BioComp Patterns 3.0
WHAT IS BIOCOMP PATTERNS?
Pattern-Based Analytics for Trading
BioComp Patterns is a financial markets signal generator that uses unique pattern clustering, matching and prediction technology to estimate future movements in the markets. It first scans price history finding and clustering patterns, then associates future price action to those patterns. When similar conditions 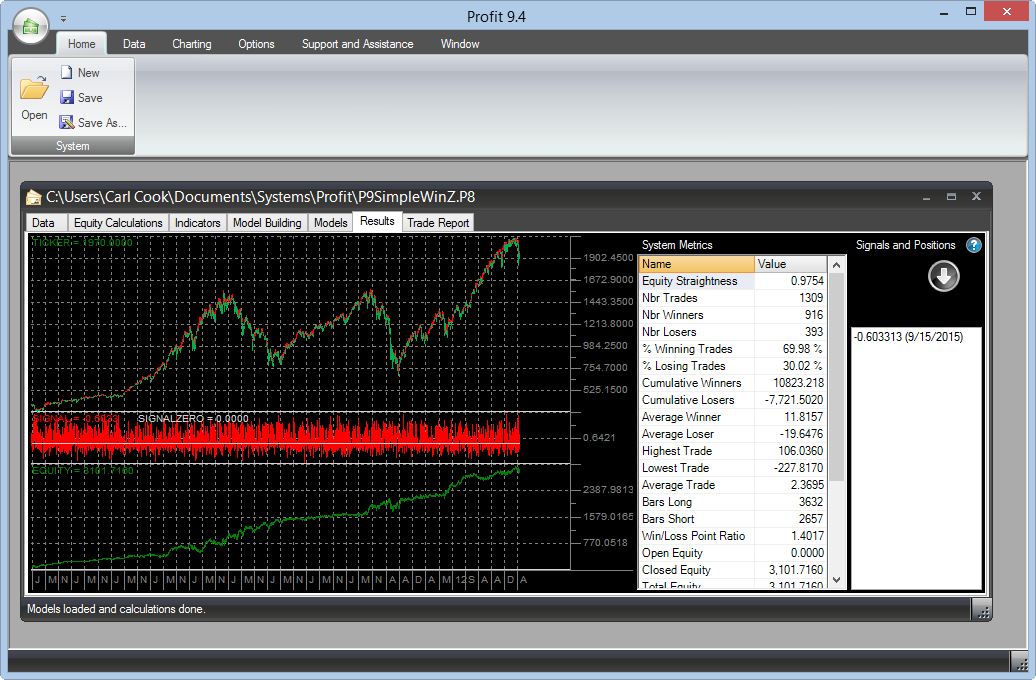 appear they are recognized and price movements are recalled. These future looking movements are then converted into trading signals using a proprietary algorithm.
How Patterns Works
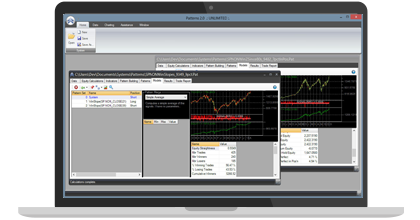
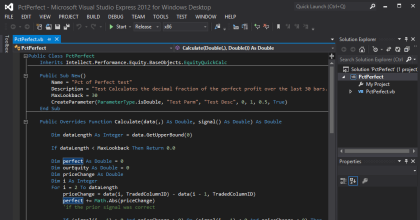
With Patterns, you import raw securities data, build indicators then use those indicators as alternative inputs to a search processes that predicts a "target" (such as the change in the next day's price). The modeling process seeks useful input indicators and performant predictive model types and internal structures. Many models are built and the top performers are brought into Patterns to act as a "committee" of models. The models' signals are combined to create a "System Model" which is more robust. You save your system(s) and each day, or numerous times during the day, update your data and open your Patterns systems and view current performance and signals from which you make trading decisions.
Good for End of Day "Swing" and Day Trading Too
You can use Patterns for end-of-day "Swing" trading, where you take and hold a position (long or short) for some number of days or use the day's forecast to adjust your strategy for day trading, looking to buy dips or short tops depending on the expectation of the day's move direction. Patterns also supports reading intra-day data from text files that have date and time in the first column so you can build intra-day models too!
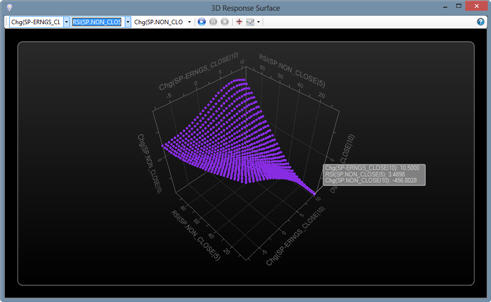
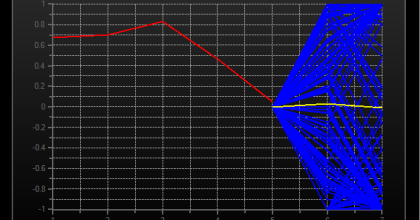
Robustness Verification
Various features enable you to check the robustness of your systems, including holding back and then processing unseen data and 3D response surface displays that graphically show you models' behavioral complexity.
Key Drivers
Indicator sensitivity analysis shows you in a ranked list which indicators are driving the change in the markets.
KEY BENEFITS
Pattern Identification and Recognition for Trading
Buy
Get a license to Patterns in a one time fee. Click the button to head to the store.
Buy Patterns! >>Upgrade to Patterns 3.0
Upgrade your license to Patterns 3.0. Click the button to head to the store.
Upgrade! >>KEY FEATURES
What we deliver to you
TECHNICAL REQUIREMENTS
What kind of computer do you need?
BioComp Patterns has the following technical requirements:
- Works on XP, Vista, Windows 7, Windows 8/8.1 and Windows 10
- 4 GB RAM minimum, 8-16 GB is typical
- Minimal hard disk space to install
- Multi-core processor suggested
- Uses .NET 3.5
- Internet connection required to activate and to easily move your license from one machine to another
"I have systems just keep performing... for years".
 Texas USA
"It is one of my best tools"
 North Carolina, USA
DISCLAIMER: BioComp Patterns is not a trading system. It is a software tool for creating market timing systems. BioComp Patterns' output is not, and should not be considered, trading advice. This web page and others associated with it on this web site may make statements regarding performance of market timing systems created using BioComp Patterns or for trading and/or trading systems to which BioComp Patterns may contribute information. This performance is hypothetical or, such in the case of performance statements by customers or members of the press, cannot be or have not been substantiated by records of actual trading and thus must be treated as hypothetical. Hypothetical or simulated performance results have certain inherent limitations. Unlike an actual performance record, simulated results do not represent actual trading. Also, since the trades have not actually been executed, the results may have under- or over-compensated for the impact, if any, of certain market factors, such as lack of liquidity. Simulated trading programs in general are also subject to the fact that they are designed with the benefit of hindsight. No representation is being made that any account will or is likely to achieve profits or losses similar to those shown.